R: Plotting Map of Germany with ggplot2
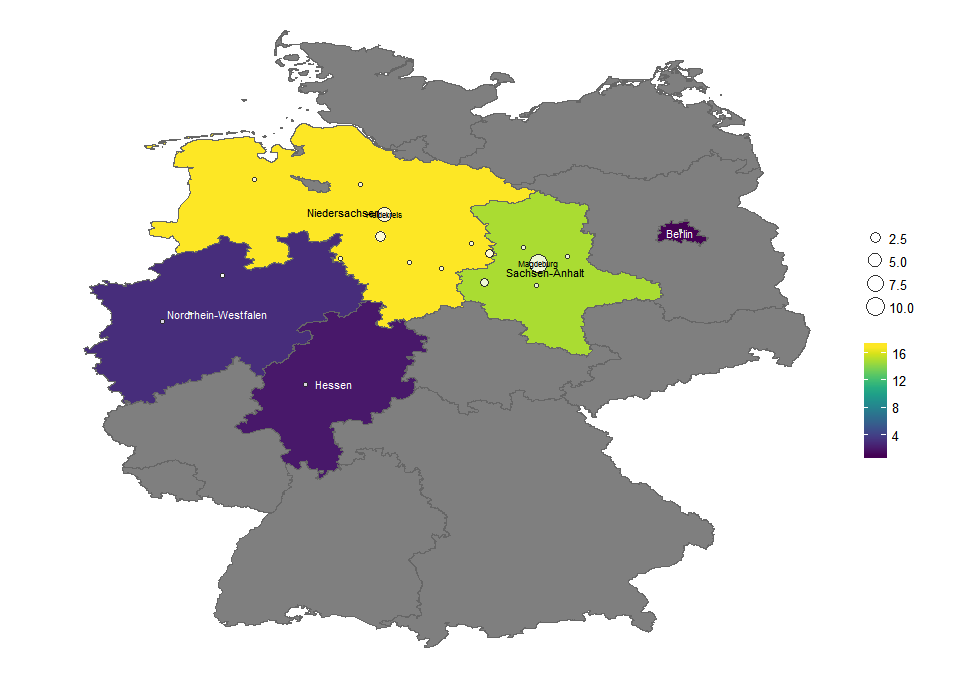
This is a collection of links to blogposts and tutorials that helped me putting together a choropleth map of germany at the level of states and postal code areas. I started out with a set of postal codes (german: Postleizahlen) and wanted to convert these to frequencies per city and per state. The resulting map was a choropleth map indicating counts per state and an extra layer with circles indicating the counts per city and district (german Stadt and Landkreis). This visualisation is useful if your postal code data is sparsely distributed accross the national level. If your data contains information for all or almost all cities or discrits, a choropleth map for the according level should do the trick. The following steps will be needed:
- Download German Map Shapefiles
- Download German Postal Code Data
- Combine Map Data and PLZ Data
- Plot Choropleth Map
- Plot Map with Circles as Cities or districts
- Add labels
Link Collection
Tutorials for Plotting German Maps
- Infomaps using R – Visualizing German unemployment rates by district on a map (Landkreise)
- Tutorial: Kartenvisualisierung mit R (Anzahl Haushalte in Stadtteilen von Kassel)